Behavioral monitoring for the systems your team operates
Monitor what your website is actually doing.
Everything that actually breaks happens above HTTP 200.
Logystera reads the activity coming out of your WordPress or Drupal site and tells you the moment something starts behaving differently — not when a customer does.
- See operational state at a glance. What your application is actually doing: auth, errors, mail, cron, queue work, in language anyone on the team can read. Delivered as dashboards.
- Know the moment behavior changes. With the evidence that triggered the detection. Deterministic, reviewable, and arrives as an alert.
- Install one plugin. Nothing to tune. No queries to write.
Not uptime. Not log search. The layer in between.
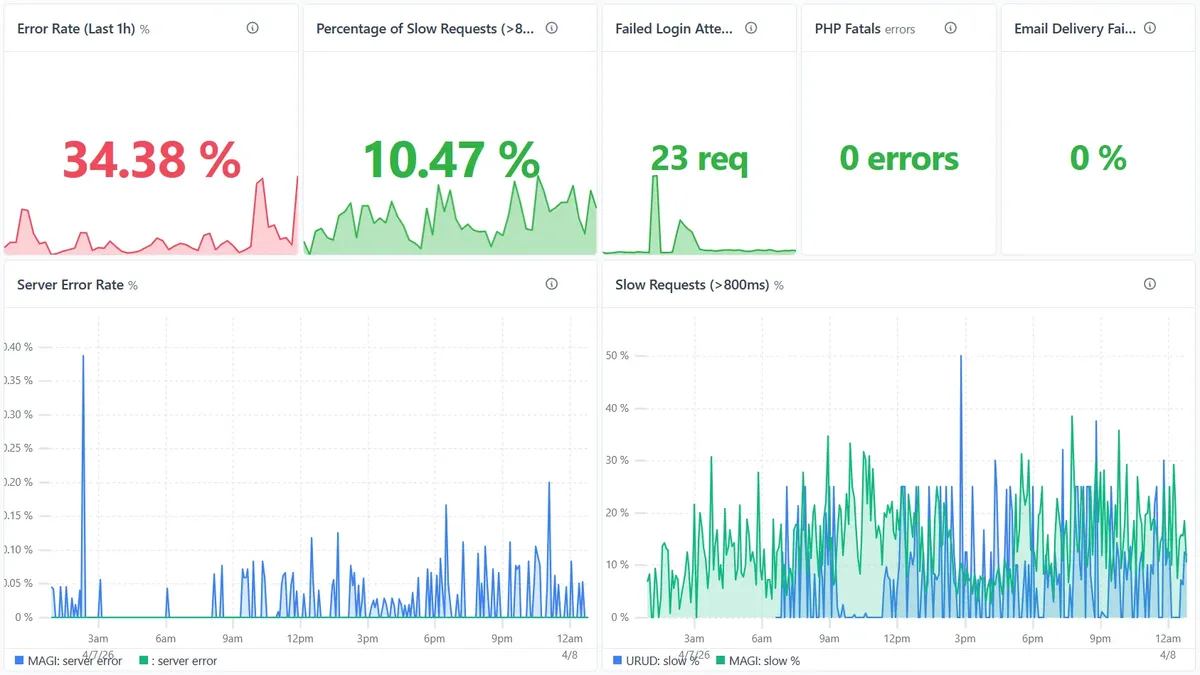
Alerts with evidence. Not “something might be wrong”. The signals that fired, and what they said.
Uptime is not health.
Forms submit and never deliver. Cron quietly stops running. Errors pile up in a file no one opens. A 200 OK is the lowest possible bar for “working”.
Built for real operational environments
Logystera runs alongside the systems teams already use.








Not a status page. Not a log search tool. Logystera gives you a continuous, readable picture of how your operational systems are actually behaving, and tells you when that picture changes.
Current integrations: WordPress and Drupal. The engine isn't bound to either.
| Uptime monitors | Log search tools | Logystera | |
|---|---|---|---|
| What it watches | HTTP response | Raw log lines | Application behavior |
| What you get | “Is it up?” | Query results | A read on operational state |
| Setup | Minutes | Hours–days | 5 min plugin install |
| Catches silent failures | ✗ | ✓ if you write the query | ✓ Out of the box |
Logystera doesn’t replace the heavyweight log tooling your infra team uses. It covers the behavioral layer most WordPress and Drupal sites are running blind on. How we fit in →
The kinds of problems systems quietly carry, for months, sometimes years.
The contact form quietly stopped sending email
The form still says “Sent.” The server returns 200. wp_mail() is failing one layer below and nothing in the request path notices. Three weeks of submissions go into the void.
Scheduled work hasn’t run in months
A flag flipped. A plugin overrode cron. The site loads, the admin loads, but nothing scheduled has executed in three months. Cron isn’t part of the request path. HTTP can’t see it.
Authentication behavior just shifted
501 failed logins against one account in 30 minutes. The security plugin blocked most. Some got through to xmlrpc.php. None of it was visible to a status check.
Your uptime monitor returns 200 OK for all three. The site is still behaving badly.
If you only need to know whether the server is responding, you don’t need this.
Understand what your systems are doing. Find out when that changes.
Install the WordPress plugin or the Drupal module. From the activity your systems are already producing (auth, requests, cron, mail, errors, queue work), Logystera builds an operational picture you can read at a glance. The moment that picture shifts in a way that matters, you find out, with the evidence attached.
5 min to install. 40+ behaviors watched out of the box. Under a minute from change to alert.
What an unhealthy system quietly looks like
A few real patterns from customer sites. The kind of degradation no status check would ever surface.
Scheduled work stopped
No cron-tick signal for 422 days. Logystera detects the absence, not just the presence, of expected behavior.
Impact: missed scheduled invoices, queued backups that never ran.
Email delivery quietly failing
23 days of wp_mail() calls returning failed delivery. Forms still said “Sent”.
Impact: ~340 leads lost during a campaign push.
Error rate shifted on one endpoint
A previously-quiet PHP fatal started firing on every search request. Six weeks of stale results before anyone looked.
Impact: on-site search conversion dropped 40%.
Authentication behavior changed
501 failed logins in 30 minutes against one account. The security plugin blocked some; xmlrpc.php traffic got through.
Impact: compromised admin account led to defacement.
Queue depth stopped draining
Drupal newsletter queue had 34 days of accepted but never-processed items. The worker process was alive the whole time.
Impact: 12,000 subscribers missed a product launch.
Checkout completion rate dropped
Stripe webhook 500s on one event type for 11 days. 340+ orders charged but never fulfilled.
Impact: $47k in disputed charges and chargebacks.
Read state. Get told when state changes.
Read state. At any moment you can see how your systems are behaving: auth, mail, cron, queue work, error patterns, request shape. It’s your application’s operational picture, in human language. The kind of thing you’d glance at while doing something else, and the kind of thing an engineer hands a stakeholder during a postmortem.
Get told when it changes. When the operational picture shifts (cron stops, error rate climbs, a previously-quiet workflow starts failing), you find out, with the evidence that triggered it. Not “something might be off”, but “this thing started behaving differently at 14:18, here’s what fired”.
State is for reading. Change is for interrupting you.
If you’ve ever found out about a problem from a user, this is for you.
What an alert actually looks like
When behavior changes, you don’t get a heads-up. You get an answer. With the evidence that produced it, the rule that matched, and what’s affected.
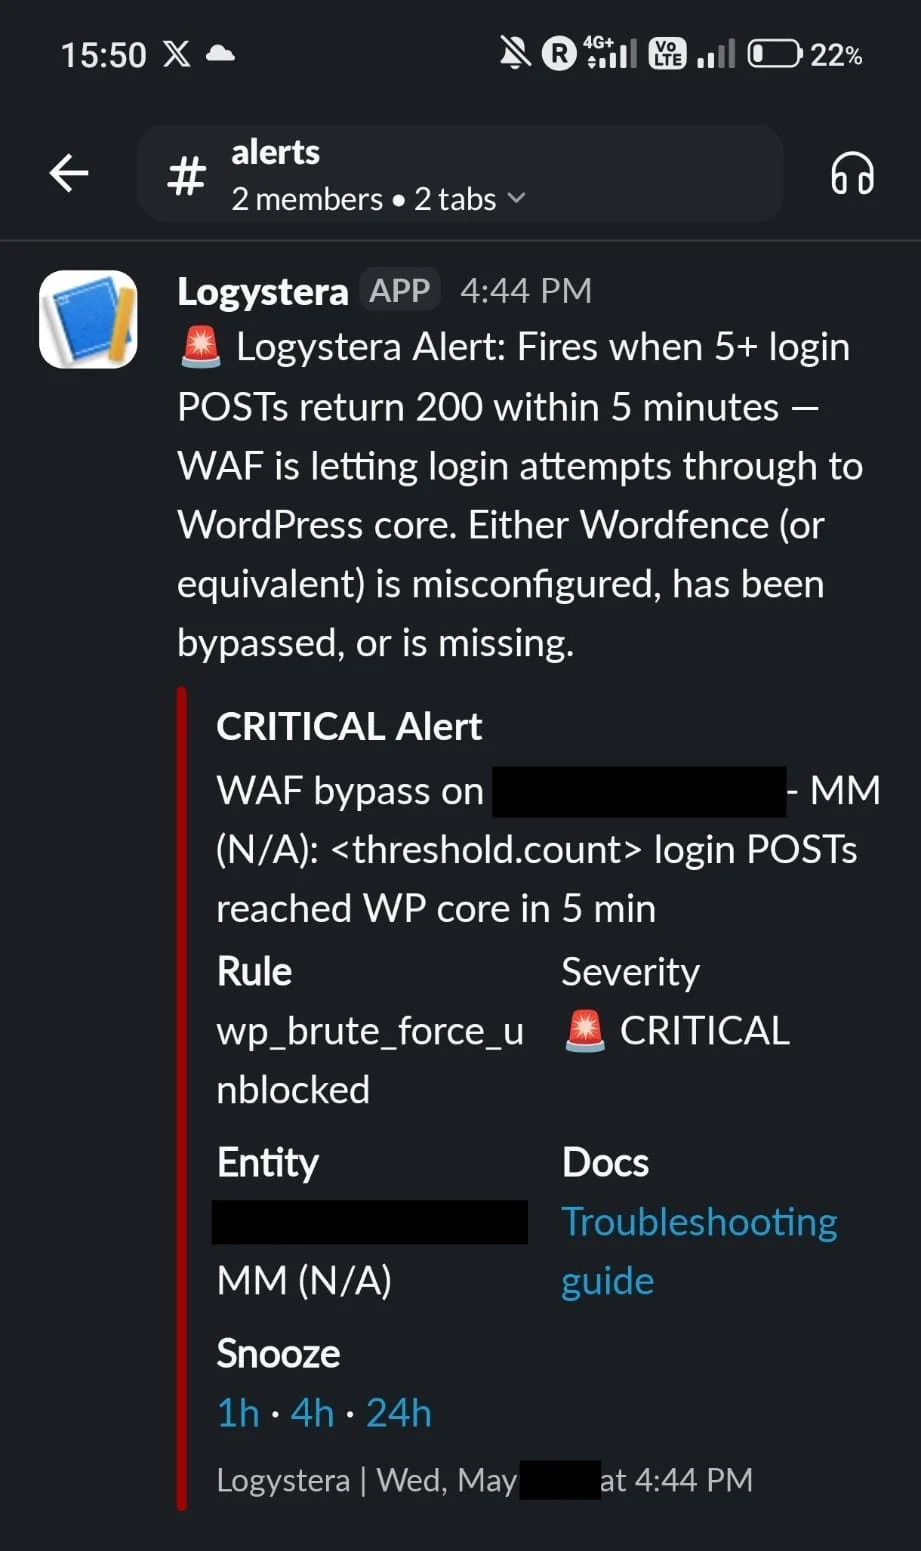
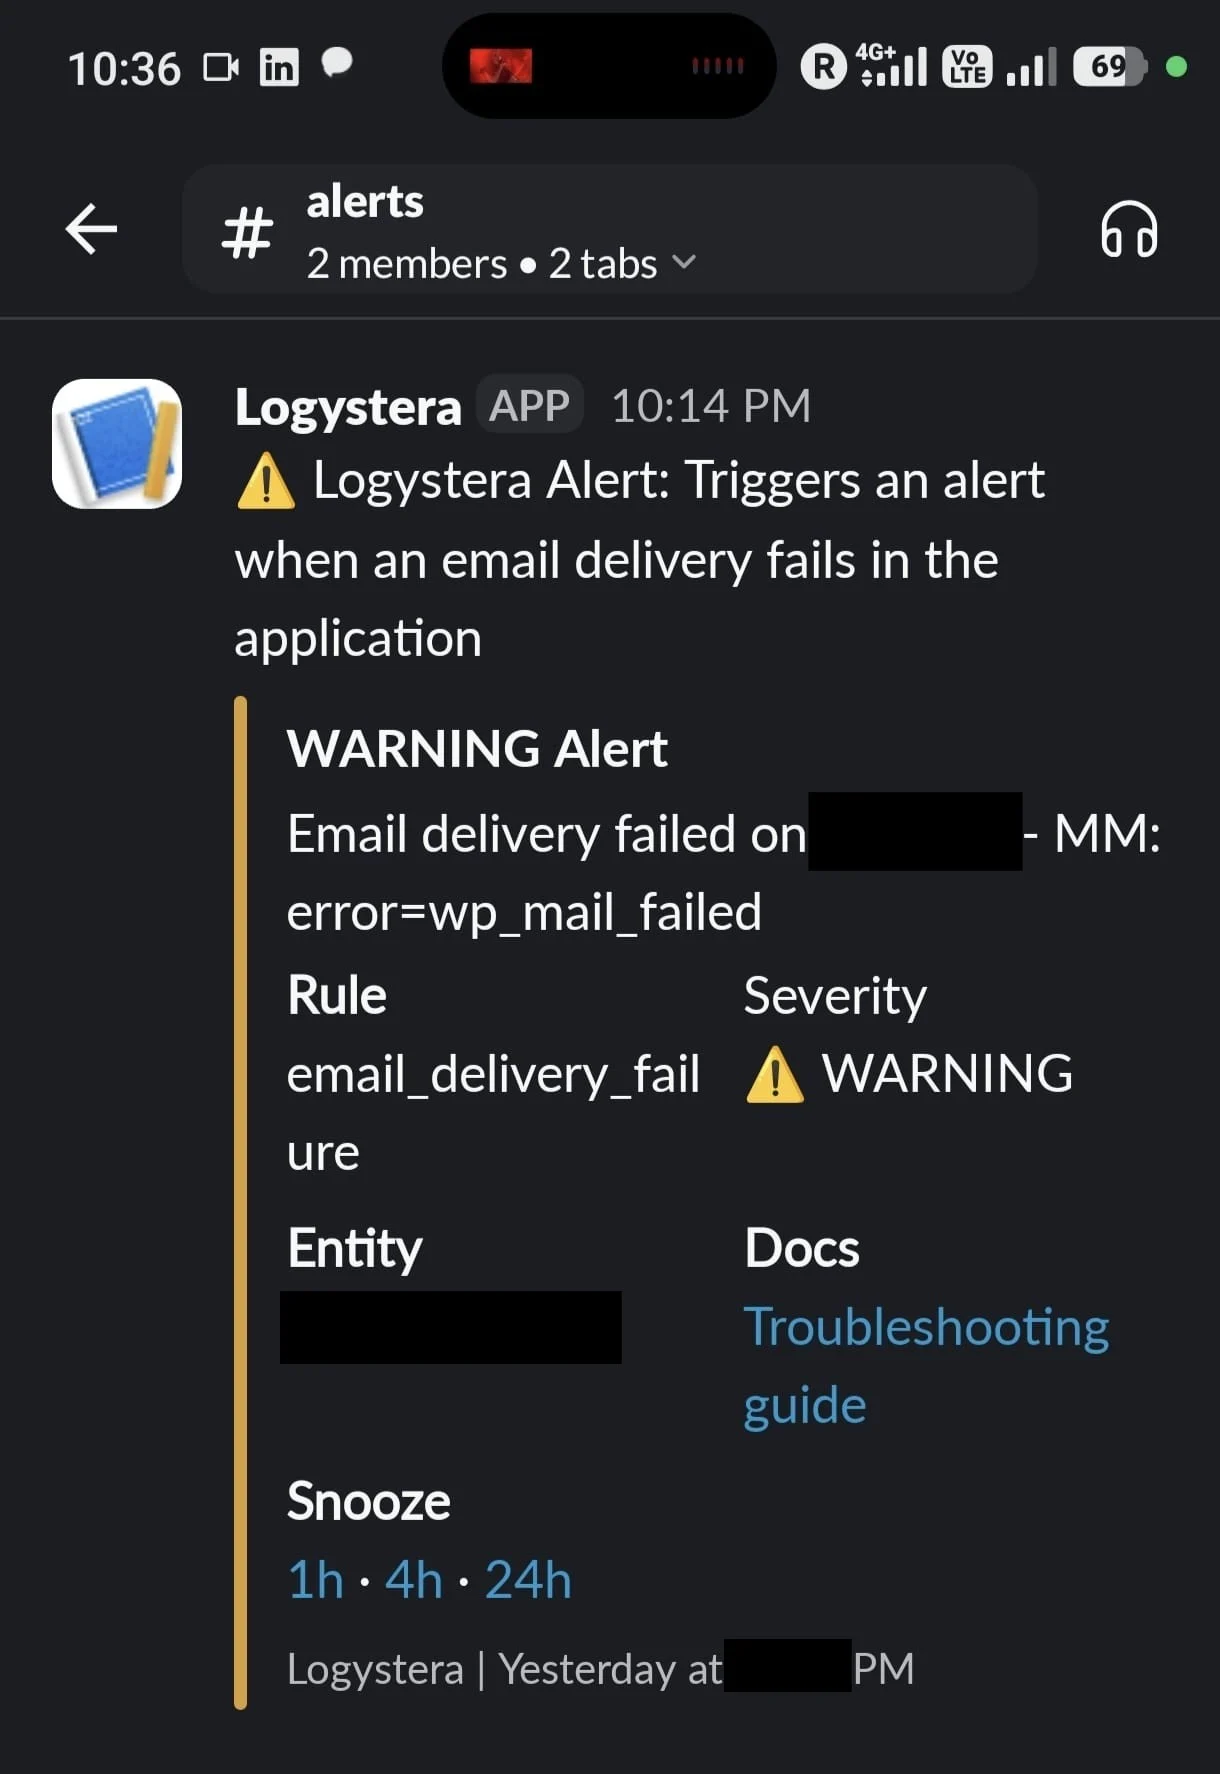
wp_mail() failed silently inside the application. This is what catches it.
None of these would trigger a status-page check.
Real alerts. Customer name redacted in-image. Rule names, severity, evidence, and snooze controls are exactly what arrives in your Slack.
Two products
Live attention. And a slower read.
Two different ways to understand what your systems are doing. They’re not tiers of the same thing. They answer different questions.
Monitoring
Real-time behavioral attention
Continuous. Always running. The operational picture of your systems as they actually are, right now, with alerts when that picture shifts in a way that matters.
⚠ Scheduled work stopped firing
0 hooks executed in the last 30 minutes. Expected: ~12/hour for this site.
Last successful hook: wp_version_check at 14:23 UTC (43 minutes ago).
[Alert continues with the last 5 cron events and snooze controls.]
- Read system state at a glance, anytime
- Know when behavior shifts, with the evidence that triggered the detection
- Pre-tuned for the failure patterns WordPress and Drupal sites actually have
Answers: what is happening, and is it normal?
See monitoring pricingReports
Human-reviewed interpreted summaries
Weekly. Read once. Not a dashboard export. A written read on how your systems have been behaving, the patterns that matter, and the things worth a follow-up. Reviewed by a human before it’s delivered.
⚠ One subsite is still crashing on every cron tick — the roles database state needs attention.
The monitoring agent recorded 4,926 error events from one subsite this week, all the same TypeError: array_keys() crash in WordPress core’s roles handler, triggered each time the cron job tries to read that subsite’s permissions. Roughly 800 per day, consistent across every day we observed.
The crash is happening inside WordPress core code, not inside a plugin. The underlying cause appears to be that the wp_user_roles database option is storing something other than the array WordPress expects. Since last week’s report there has been no change in the error rate, which suggests the issue is persistent in the database rather than something that self-heals.
[Report continues with WP-CLI commands to verify and remediate.]
- Specific. Cites the signals. Quotes the evidence.
- Actionable. Recommends what to verify and how.
- Forwardable. Reviewed by a human before it’s delivered.
Answers: what has been going on, and what should we do about it?
Talk to us about reportsMonitoring is the attention layer. Reports are the interpretation layer. Most customers run both.
What operators have said
Real customer feedback, anonymized to the platform they operate.
“This reminds me of Qualys vulnerability reports.”
A customer’s TTFB dropped from 1.7–3.3 s to 130–140 ms after they acted on the audit Logystera shipped.
“I added another site to Logystera. That one had been hacked a couple of times in the past — I secured it using the findings.”
Want to dig deeper?
Everything we’re glossing over on this page has its own.
In the wild
What behavioral monitoring actually surfaces. Operational case studies from real customer sites, anonymized, with the numbers intact.
Read the findingsHow it works
The mechanics. What signals are read, how detections work, what gets delivered, and what the system deliberately doesn’t do.
Read the architectureSupported integrations
WordPress, Drupal, HashiCorp Vault, with more on the way. See what’s live and what’s coming.
See integrationsSecurity & data
Which signals we capture (and which we don’t), where data lives, retention, encryption.
Read security policyDocumentation
Full signal reference, install guides, API reference, troubleshooting.
Read the docsSecurity & data handling
- Your data, your control. We don’t sell, share, or train on your signals.
- Structure, not content. Signal metadata, not page bodies or PII.
- Configurable retention. 7d / 30d / 90d+ by plan.
- Encrypted. In transit and at rest. Default, not premium.
Two products. Two ways to pay.
Pricing reflects what you’re buying: continuous attention, or an interpreted read on what’s been going on.
Monitoring
Real-time behavioral attention
Free
$0
Try it out on one site
Read site state. Core metrics and one alert rule. One site.
Move up when: you want the full detection set, or watch more than one site.
Start free →Standard
$29.99/site/mo $59.99
For teams and agencies
Billed per site, up to 10. Full set of behavioral detections (40+). Behavioral insights for every site you watch.
Move up when: you need SSO, audit trail, SLA, or more than 10 sites.
Lock in $29.99 →Enterprise
Custom
Compliance-grade, contracted
Unlimited sites. SSO. SLA. Audit trail. Data residency.
You’re here if: compliance requires DPA, audit trail, or residency guarantees.
Talk to sales →Reports
Human-reviewed interpreted summaries
Single report
One-off
See what we’d send you
An interpreted read on your systems over a window of your choosing. Useful before a board meeting, after an incident, or to prove you should have caught something sooner.
Available on request.
Subscription
Weekly
A reading habit, not a notification
A weekly written read on how your systems have been behaving. Trends, the things that quietly shifted, what’s worth a follow-up. Forwardable to stakeholders.
Best paired with monitoring.
Set it up →Enterprise
Custom
Bundled, custom scope
Reports across a portfolio, redacted for sharing, on whatever cadence makes sense. Bundled with enterprise monitoring.
Talk to us about scope and redaction needs.
Talk to sales →Most teams start with monitoring on their 5–15 most important sites, then add reports for the ones a stakeholder cares about.
No credit card required for monitoring trials · Cancel anytime
Drupal and Vault pricing differ. See all plans →
See what your systems are actually doing.
No probes. No queries to write. No rules to tune. Install once and read the behavior.
Installs in 5 minutes · No credit card
