WordPress Monitoring from Logs
See what your WordPress site actually does - not what uptime monitors report. Email delivery, cron health, PHP errors, login attacks, admin performance - all derived from logs automatically.
What Logystera catches in WordPress
These are real failures on production WordPress sites. Your uptime monitor can’t see any of them.
Contact form emails disappearing
Forms submit, nothing delivers. SMTP breaks silently after plugin updates. 23 days of lost leads.
Cron stopped for 422 days
Migration disabled wp-cron.php. Replacement never configured. Scheduled posts in draft, options table at 1.8 GB.
PHP fatals on every request
Error handler swallowed it. Search indexing broke. 6 weeks of stale results. Nobody connected it to the update.
501 failed logins in 30 minutes
Brute force at wp-login.php. Security plugin blocked most but missed xmlrpc.php entirely.
How to set up
Install the plugin
Upload the Logystera WordPress plugin. Activate it. No dependencies.
Connect to Logystera
One click. The plugin fetches its API key for you. Events start flowing immediately. 24 signal types by default.
See metrics in minutes
Dashboards, alerts, and derived metrics appear automatically.
What you see immediately
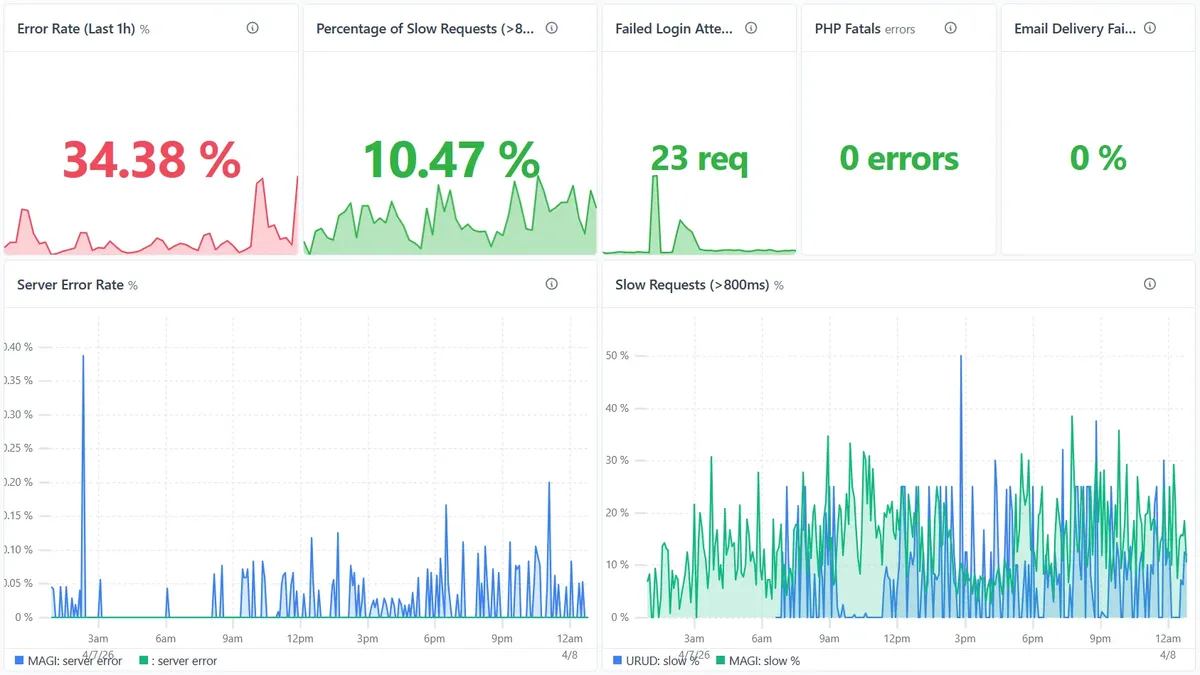
Failures surface immediately
Error rate, slow requests, failed logins, email delivery - derived from real events.
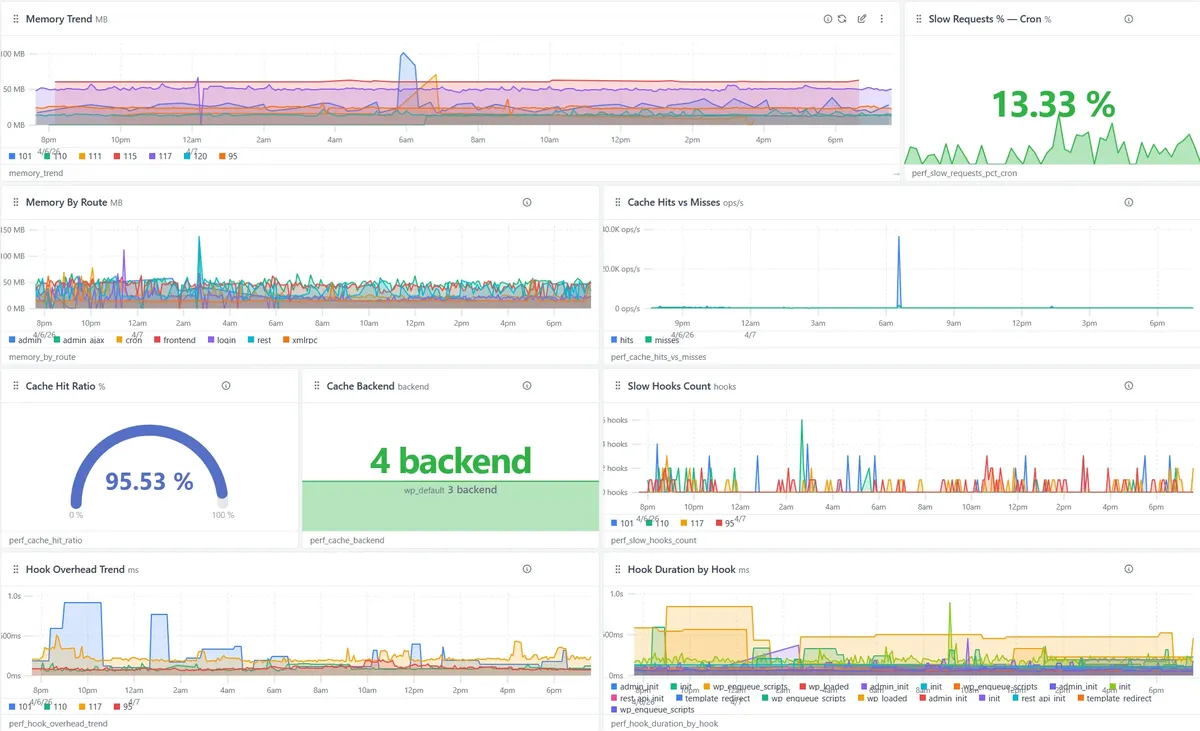
Where the problem actually is
Memory, cache hit ratio, slow hooks, admin vs frontend - breakdowns that point to the source.
Features
24 signal types, dashboards, metrics, alert rules, Insights.
View features →
Pricing
Free tier + paid plans. Early adopter pricing available.
View pricing →
Guides
50+ guides covering cron, email, errors, brute force, and more.
View guides →
Screenshots
Real dashboards, real metrics, real alerts.
View screenshots →
Five minutes to install
See what your WordPress site is actually doing.
Install the plugin from the WordPress directory. Within hours you'll see auth, mail, cron, errors, and the rest, in one place. Within days you'll know whether your site is silently failing in any of the ways customer sites usually are.
Free to try on one site. Cancel anytime. No credit card.